Graph drawing can be a difficult problem. Coulomb simulation is used in a class of algorithms for drawing graphs in an aesthetically-pleasing way without any special knowledge about graph theory. In a Coulomb simulation, we assign forces among the set of edges and the set of nodes. Based on their relative positions, we use these forces either to simulate the motion of the edges and nodes or to minimize their energy. We also call these methods force-directed algorithms.
Coulomb simulation
When an electrostatic force acts between two or more charged particles within a system, a potential energy can be assigned to that system. This energy is a result of conservative Coulomb forces and is based on the relative positions and magnitudes of the point charges. Coulomb's Law declares the magnitude of the electrostatic force of interaction between two point charges and the electrostatic potential energy stored in a system of charged particles. It is analogous to Isaac Newton's inverse-square law of gravitation. Coulomb simulation is a physical simulation of such a system.
Layout optimization
When the graph is simulated as a system of charged particles, its layout is achieved through motion simulations or energy minimization. We use the latter and apply the Nelder-Mead simplex method to minimize an objective function returning the electrostatic potential energy. Nelder-Mead optimization is an iterative process that continually refines a simplex of D + 1 vertices in D dimensions. The optimizer evaluates the objective function at each iteration and explore the parameter space through four actions, reflection, expansion, contraction, and shrinkage. The effect of each action is controlled by a scalar constant supplied to the algorithm.
Example web applications
As examples of Coulomb simulations, we present nemetree and nemepos for visualizing trees and partially-ordered sets, respectively. In both examples, we optimize graph layouts using numerical optimization over an objective function through Coulomb modeling of an electrostatic field.
All source code for these examples is available on our Github.
Tree visualization: nemetree
Visualizing tree structures play an important role in many fields. For example, a traditional way to illustrate phylogenetic relationships among species is to model them using a tree, i.e. a phylogeny or an additive tree. This type of tree forms the basics to represent differences between species and to analyze those differences statistically.
Our web application accepts input tree structure in the Newick format. For example, (A:1,B:1,C:1)D; is a tree of three equal-length edges and four nodes where D is the hub.
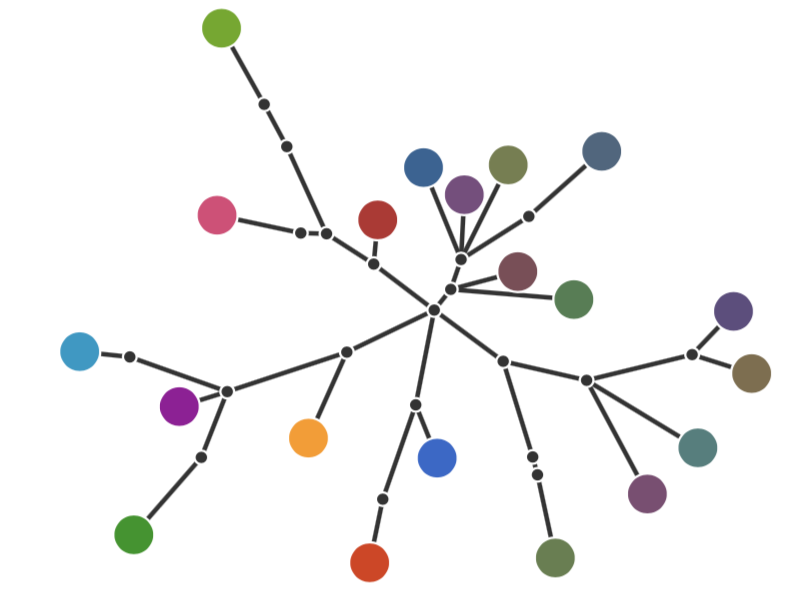
Here's an example of a simple tree visualized by nemetree:
And here's what very large trees might look like:
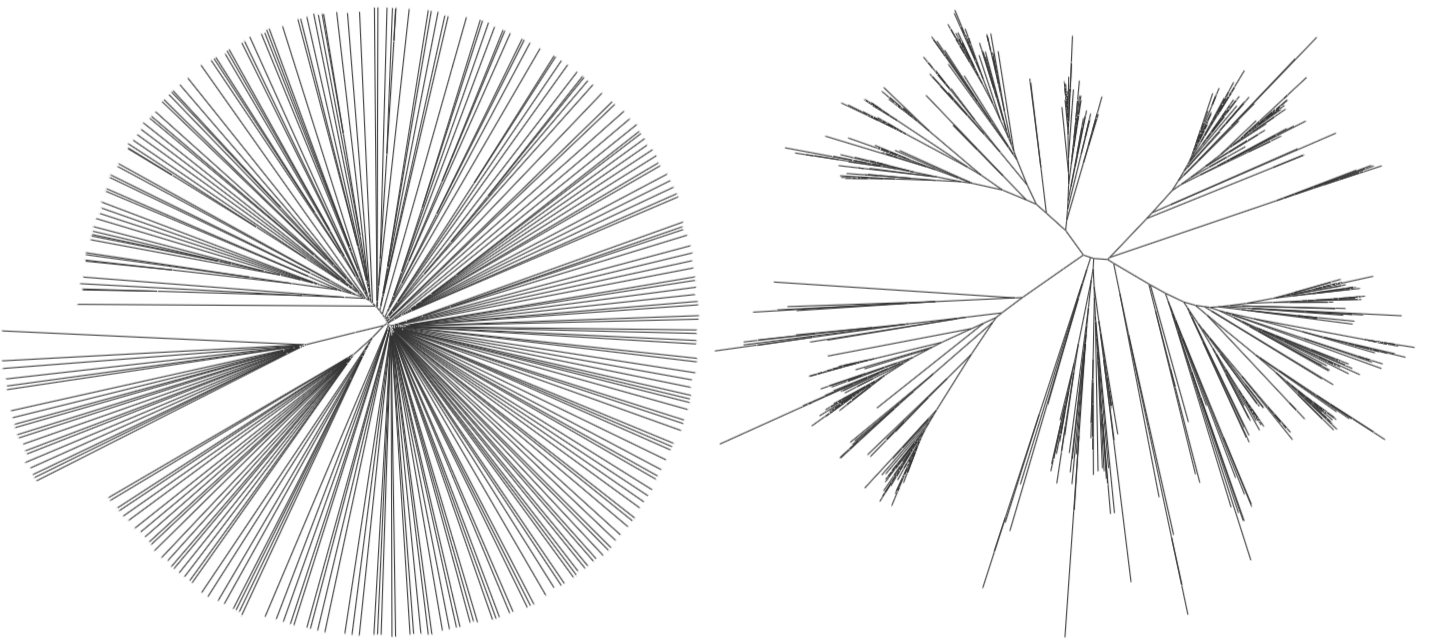
The left tree contains 528 nodes. The right tree contains 1014 nodes. (When dealing with very large trees we recommend disabling the optimizer.)
DAG visualization: nemepos
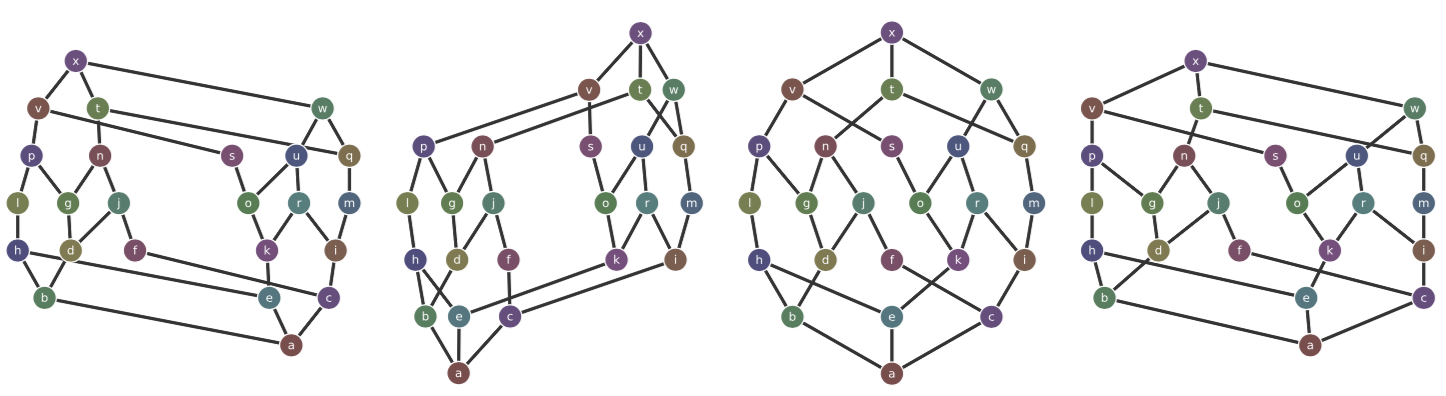
Hasse diagrams visualize strict partial order relations through a layered graphical representation of their transitive reductions (directed acyclic graphs). A Hasse diagram uniquely defines a finite partially ordered set (poset), but a poset maps to many Hasse diagrams. We call them isomorphisms. Even though Hasse diagrams are simple and intuitive, it's often hard to find a “good” one. A “bad” Hasse representation is mathematically correct but usually useless in practice.
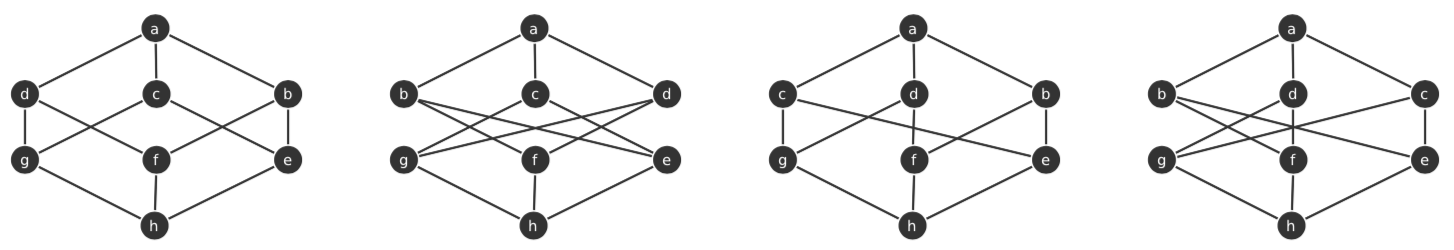
In the above figure, we see four isomorphisms representing the lattice of the subset of three. nemepos produces the first because it has the fewest edge crossings.
nemepos applies a compact layering schema for level assignment, a heuristic-based cross minimization and a targeted local cross elimination for within-level ordering, and a flexible sibling distances for internal structure exploration.
For example, consider the two graphs below:
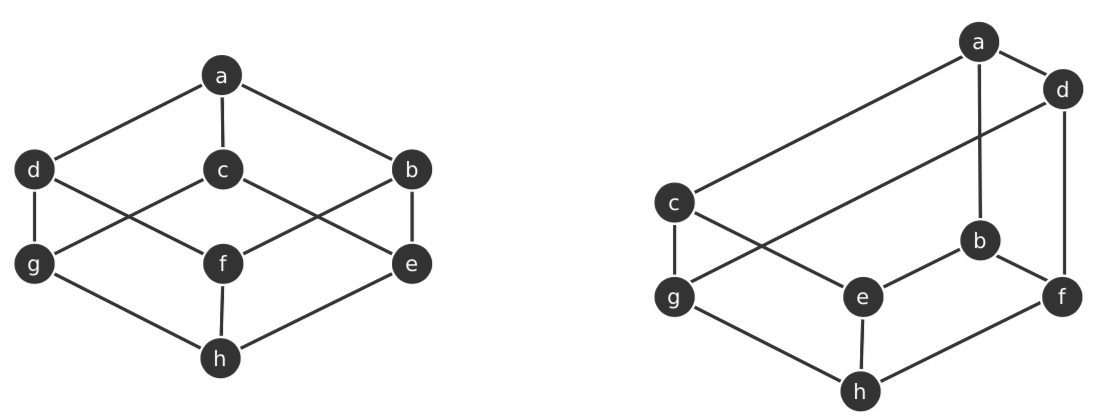
People commonly draw and prefer the left diagram. The right diagram has a different level assignment, and it was produced when minimizing the total number of different slopes. nemepos produces the graph on the left.
In the next example (below), we see within-level ordering and cross elimination for modular lattice on three generators. The left diagram is drawn perfectly by hand and the right diagram is generated by nemepos. They have the same number of edge-crossings and are similar in their final forms.
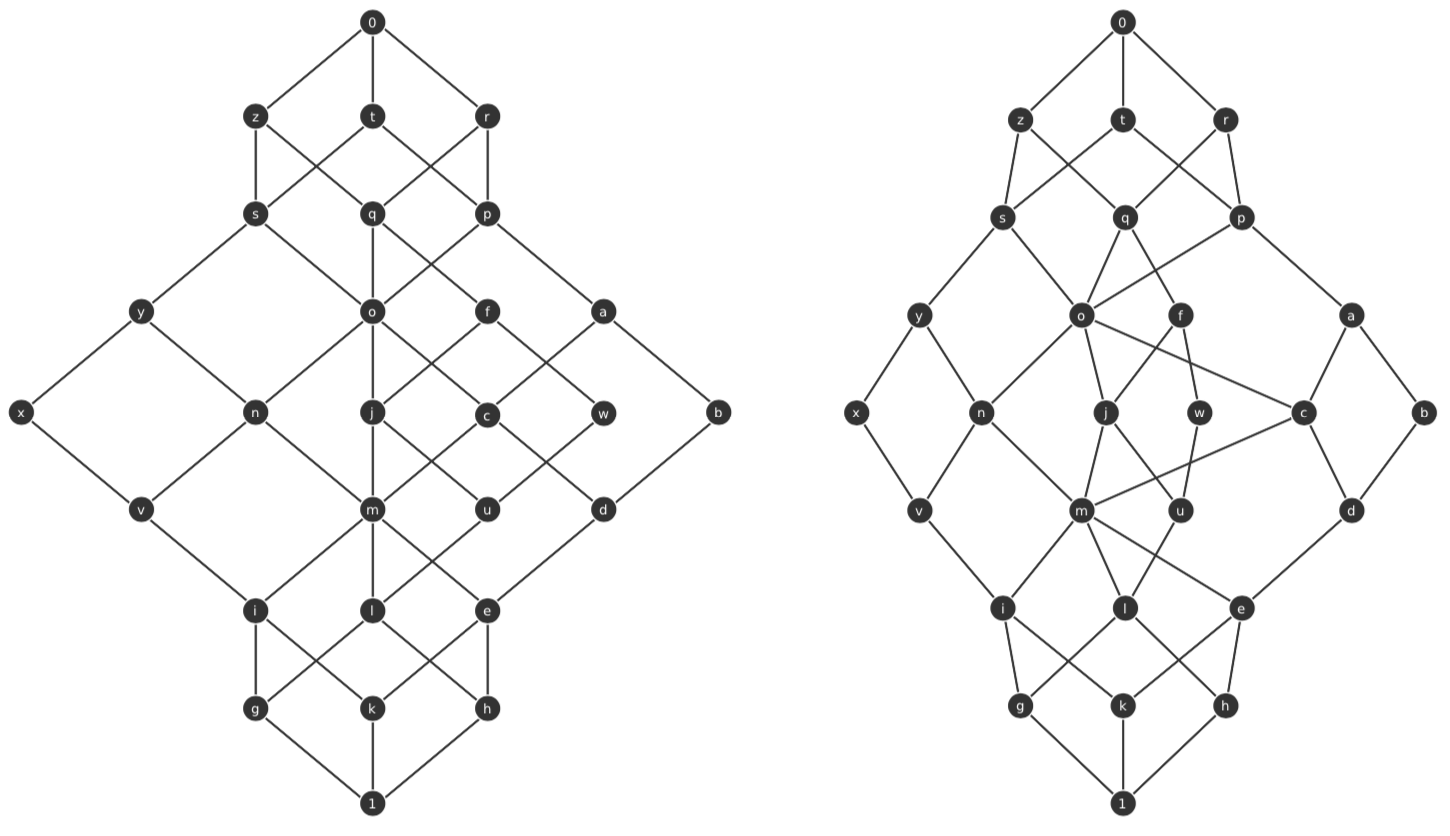
nemepos can produce all three diagrams by adjusting the nodeForce and edgeForce model parameters through the JSON configuration.
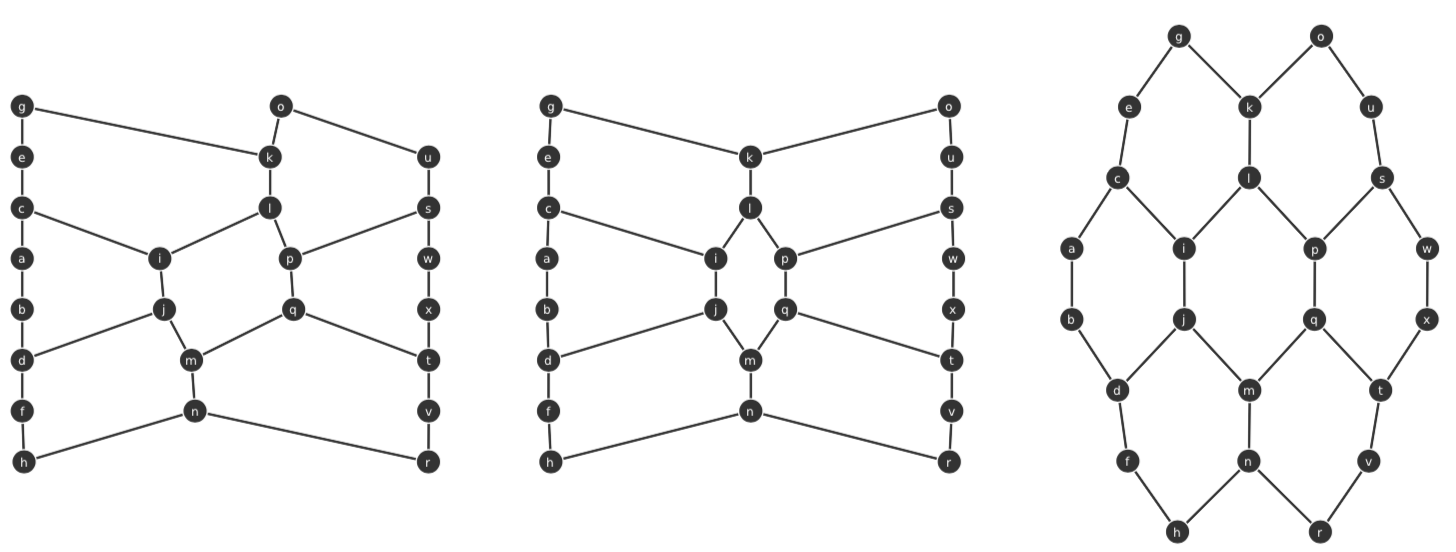
Another example of different sibling distances produced by nemepos through model parameter tuning:
Implementation notes
Both nemetree and nemepos are written in simple HTML, CSS, and TypeScript. The Nelder-Mead implementation determines the coefficients for reflection, expansion, contraction, and shrinkage based on the number of nodes in the graph and recommendations from Gao & Han, 2012. For nemetree, the optimizer chooses an initial vertex by evenly positioning each node based on the number of parents in its branch. For nemepos, the optimizer evenly distributes and centers nodes within each layer. Optimization terminates after a series of iterations leaves the simplex with two conditions met: 1. the difference between its best and worst objective values is less than a constant value ε1, and 2. the maximum distance between any two vertices is less than another constant value ε2.
General network graph visualization: D3js force
Thus far, we presented example apps that using Coulomb's physics simulation to visualize two families of graphs, trees and DAGs/posets. General visualizations of network graphs can also benefit from Coulomb simulation. D3js provides a flexible framework for such implementations through its force layout. The crux of applying D3js-force is to set up all components and parameters needed for the Coulomb simulation, e.g. nodes, edges, charges, progression ticks, etc. For details on how to set up and visualize through a force simulation using D3js, we recommend this blog post at D3indepth.
In the example below, we show a D3js force visualization of a network graph for pairwise friendship relationships. This is neither a tree nor a DAG/poset. This visualization is produced with full-length tick progression, equal-negatively-charged nodes, center-node gravity, and variable link lengths.
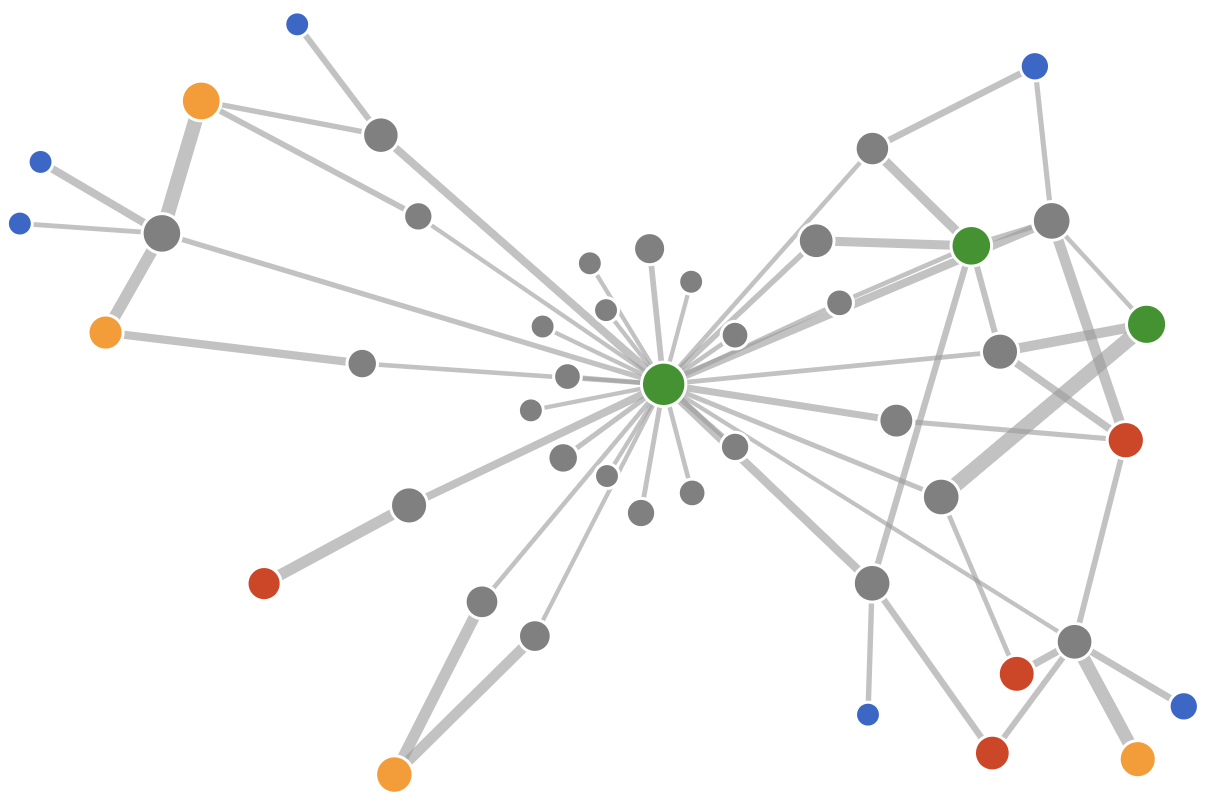
Besides the fact that nemetree and nemepos are created for specific graph types and ingest pre-defined text representations of graphs, the major difference compared to D3js is how the final layout of graphical components is achieved. The two apps minimize system energy and converge to the optimal layout through the Nelder-Mead optimization algorithm. D3js-force applies the concept of tick, and it does not guarantee a final minimal Coulomb energy nor an absolute optimal layout.
Instead, D3js offers fast computation for large graphs and leave it to the user to determine what's best for their particular use cases. Due to its flexibility and the power of Coulomb physics simulation, D3js not only is applicable to visualize general-purpose network graphs, it can also perform collision detection, gravity visualization, etc.
To learn more about these techniques, please check out our Github.
Related Work
- Kobourov, S.G., 2012. Spring embedders and force directed graph drawing algorithms. arXiv preprint arXiv:1201.3011.
- Nelder, J.A. and Mead, R., 1965. A simplex method for function minimization. The computer journal, 7(4), pp.308-313.
- Freese, R., 2004, February. Automated lattice drawing. In International Conference on Formal Concept Analysis (pp. 112-127). Springer, Berlin, Heidelberg.
- Stephan, J., 1987. Liniendiagramme von verbnden.
- Gao, F. and Han, L., 2012. Implementing the Nelder-Mead simplex algorithm with adaptive parameters. Computational Optimization and Applications, 51(1), pp.259-277.